Drawing Quadratic and Cubic Graphs Math Review
math tutorials > drawing quadratic and cubic graphs
The plotting of quadratic and cubic graphs is a vast topic and can be done in various ways. The aim of this tutorial is to introduce you to the 2 types of graphs and the tabular method of drawing them (as we did for straight line graphs).
Quadratic Graphs
The equation for a quadratic graph can be written as
![]()
a, b, and c are constants.
y has the power of 1.
x has a maximum power of 2.
The graphs of quadratic equations are called parabolas.
Examples
These are all parabolas:
![]()
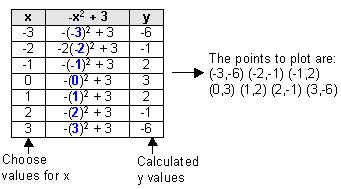
Drawing the graph
![]()
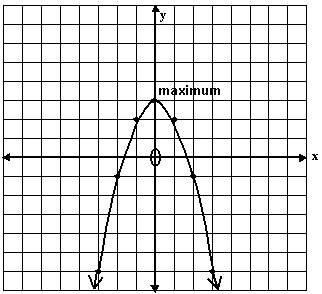
Parabola problems for you to try

![]()
Cubic Graphs.
Cubic graphs are in the form
![]()
a, b, c and d are constants.
y has a power of 1.
x has a maximum power of 3.
Examples
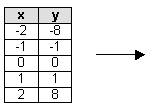
![]()
Draw the graph
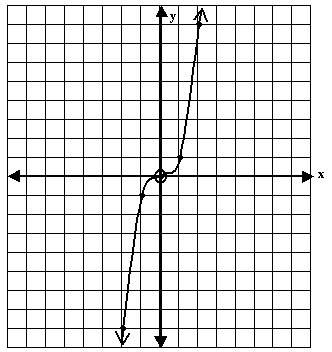
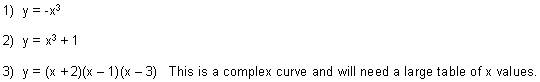
Cubic graph problems for you to try
Note:
You can calculate the intercepts of parabolas and cubics in the same
way as for straight lines.
For the x-intercept, put y = 0. (A parabola may have 2 x-intercepts,
a cubic 3).
For the y-intercept, put x = 0.